How to create a 30 Second Opening Range Indicator
Opening Range Indicator
This article will show you how to create an opening range to populate on the Chart and DOM. An opening range will show the high and low of the time you configure. For example, a 30 second opening range will populate the high and low price during the first 30 seconds of the trading day.
Opening Range on the Chart
Please find the steps below:
The first step is to add the OHLC indicator on the chart
Press "CTRL + T" or navigate to Study > All Studies > Filter > OHLC
Click, "OK"
Press "CTRL + T" or navigate to Study > All Studies > Filter > OHLC
Click, "OK"
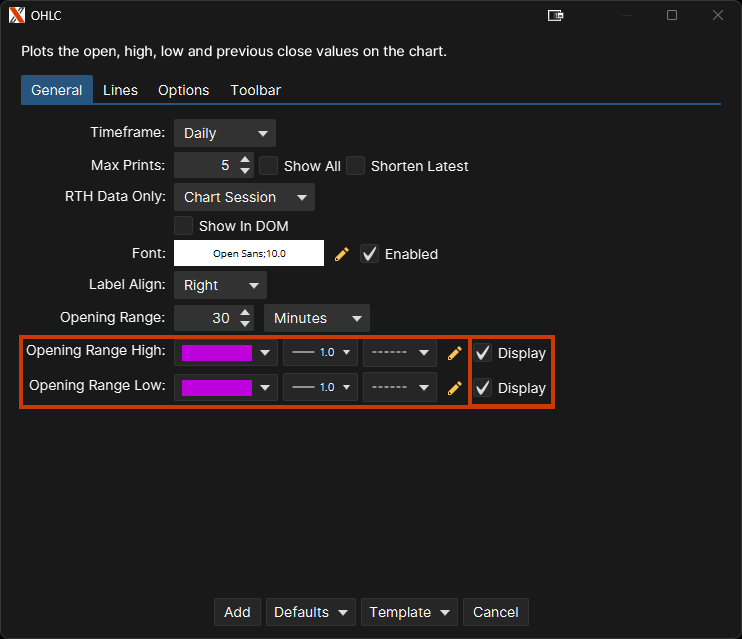
Under the "General" tab, make sure you check the display boxes for the Opening Range High and Opening Range Low:
You can choose to have the opening range in seconds or minutes
You can choose to have the opening range in seconds or minutes
You can also change the color of the opening range, thickness of the line, and line type:
In order to enable a 30 second opening range, change the Opening Range to 30 and the drop down as seconds:
Finally, select "Add" to enable the 30 second opening range
Opening Range on the Depth of Market
In order to enable the opening range on the DOM, please follow the below steps:
Click on the cog symbol on the top right hand corner of the DOM:
Form here, a the DOM Preferences window will appear. Click on the Price Column within the DOM Preferences and enable the Opening Range indicator:
You can choose to have the opening range in seconds or minutes. In this example, we will choose a 30 second opening range:
Once configured, click "Apply" then "OK"
Related Articles
Importing indicator or study
This is a how-to video that demonstrates the simple steps to import an indicator or study into EdgeProX:Cloud Levels
Cloud levels allows you to have a centralized CSV file file with all of your predefined levels. The EdgeProX software will check the file for updates once it is saved, which will automatically update your charts based on the new updated levels. The ...Create a new layout on EdgeProX
In EdgeProX, the Console and Chart Groups can have several active layouts organized into what we call "Pages." Each Page can contains a different set of panels. These panels can be filled with Charts, Watch Lists, Account Panel, and more. 1. To ...How to change the bar size on EdgeProX
In this article we will show you how to change bar size within EdgeProX to a Renko, Point & Figure, Range, etc. Please follow the steps below: Right click on the chart and select "Chart Settings" from the menu. Select the "Bar Settings" Tab and under ...Adding Alerts to EdgeProX
Alerts are used to notify a trader when an instrument trades at a certain price or volume. The alert will play a sound notification and/or send an email and can be configured to close an open active position. Create an alert To access alerts select ...